QMetry Charts Macro
Confluence users can seamlessly integrate QMetry Reports into their Confluence pages using the QMetry Chart Macro. This powerful tool empowers users to visually represent and analyze data with ease, offering options to slice, dice, or export reports in formats like Bar, Pie, Line, or Tabular views. By incorporating the macro into a Confluence page, users can easily generate dynamic live reports that display testing metrics obtained from Saved Filters in QTM4J, providing rapid access to crucial test metrics.
Insert QMetry Charts Macro
You can integrate QMetry macro through either of the following methods:
(A) Macro menu on the toolbar
Perform the following steps to insert the QMetry Charts Macro:
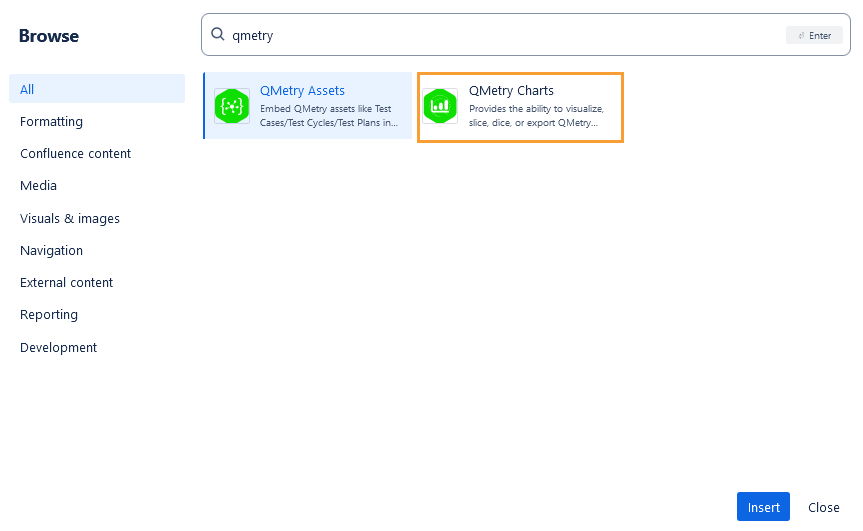
Click the macro drop-down list on the Confluence toolbar and select View More.
The Select macro dialog box appears.
Search for “QMetry”. You will see the QMetry Assets and QMetry Charts macros on the screen.
Click the QMetry Charts macro to insert QMetry Assets into Confluence.
(B) Insert a macro in a page using the / menu
Perform the following steps to insert the QMetry Charts Macro:
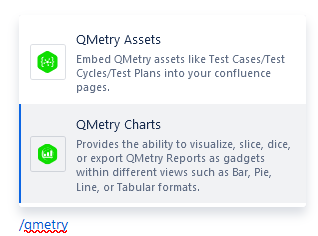
On the Confluence page just type /QMetry to prompt the QTM4J macros.
Click the QMetry Charts macro to insert it on the page.
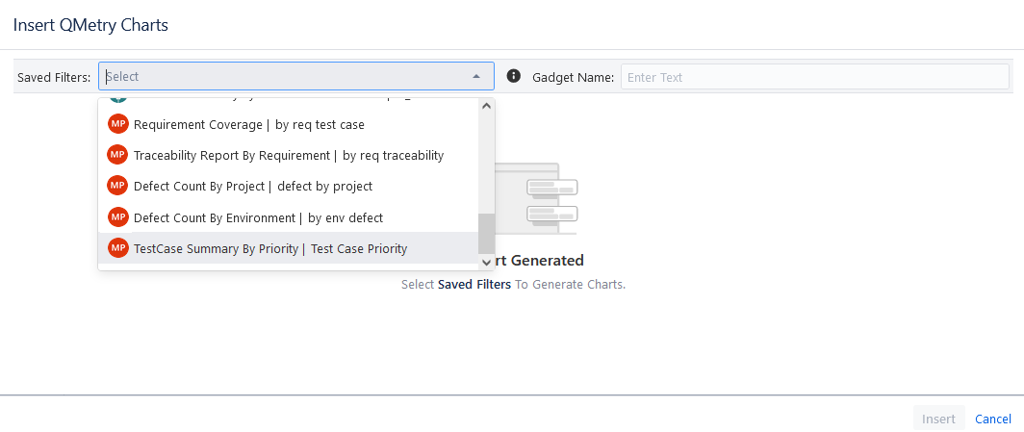
The Insert QMetry Charts dialog box appears.
Saved Filters: The drop-down list shows all the filters to which the users have access. The reports are dynamic by nature and accommodate any change in the filters.
Gadget Name: Provide the name you wish to display for the gadget on the Confluence page, other than the filter name.
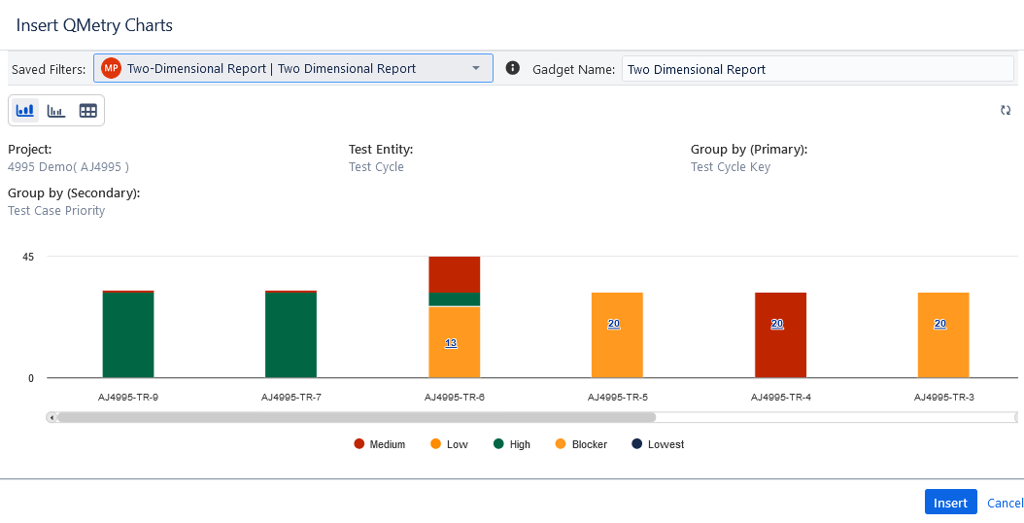
The chart is displayed as per the saved filter in the QMetry Test Management for Jira application.
The first part of the filter name indicates the report name and the second part indicates the filter name of the report.You can view multiple charts as per the report type.
Preview the generated chart.
Click the Insert button at the bottom to insert the chart on the Confluence page.
Once the chart is inserted on the page, you can drill down into the chart further and export the data.
To fetch the latest data into the existing graph, click the Refresh icon on the chart.
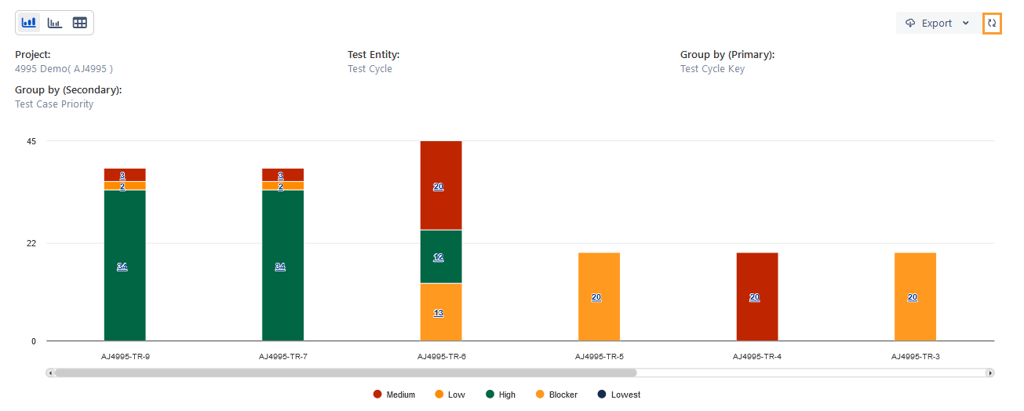
You can drill down the chart and export the details to Xlsx.
To download the Excel, go to the Notification section of the QMetry Test Management for Jira application.
Edit QMetry Charts Macro
You can edit the filter associated with the existing chart and generate a new chart.
Perform the following steps to edit the QMetry Charts Macro:
Go to the Confluence page and click Edit.
Click the generated QMetry Chart.
The icons for Edit, Copy, and Delete become visible.
Click the Edit icon to modify the report generation criteria.
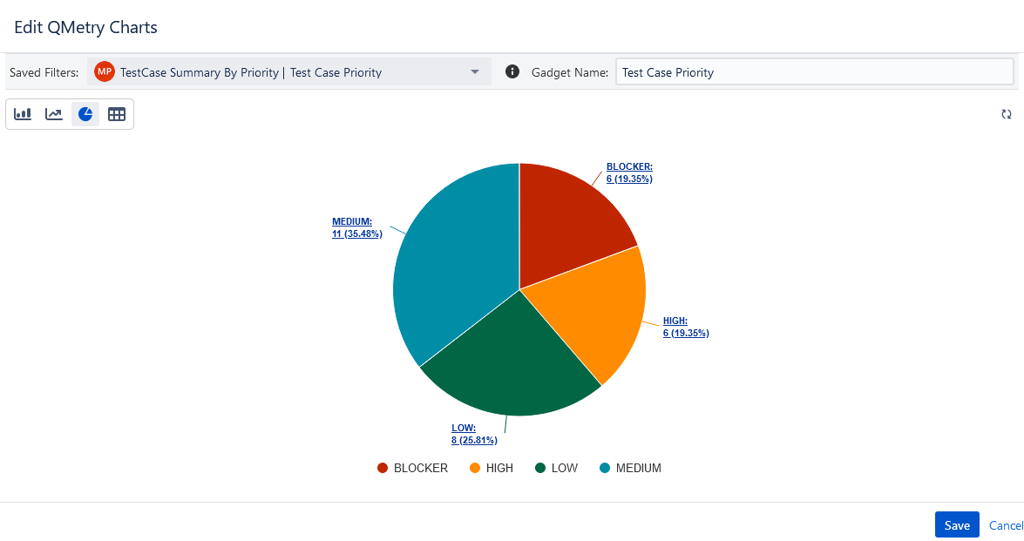
The Edit QMetry Charts pane opens.
To generate another report, select the filter accordingly and click Save.
Note
The “QMetry Charts” macro displays all the “Public (Shared with My Org, Group)” or “Private” Report gadget filters as per the logged-in user’s permissions to view QTM4J report filters.
If the criteria of the Saved Filter are changed in the Reports module, the changes will be reflected in the QMetry Charts macro on refreshing the Confluence page
Export QMetry Charts
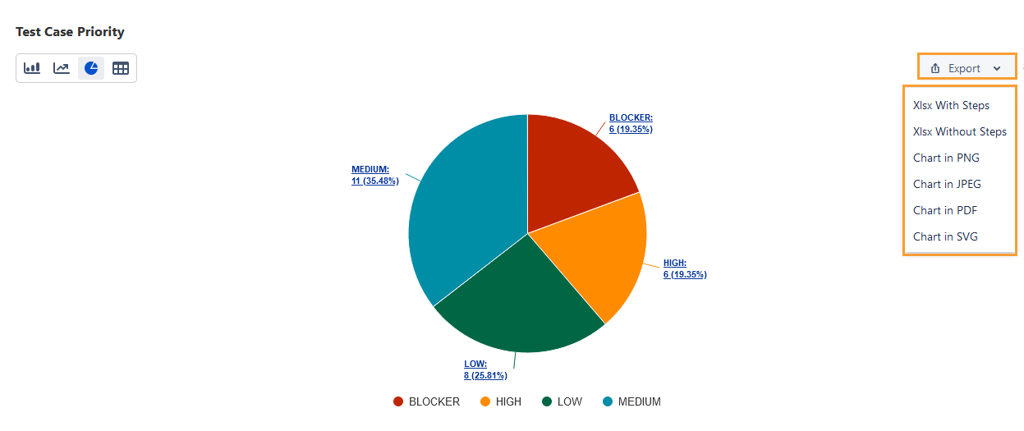
You can export the chart from within the QMetry Charts macro. Once you generate the chart in the macro, click the Export drop-down list and select the option to export the chart data.
You can export the Tabular View in the following formats:
Xlsx with Steps, Xlsx without Steps, CSV with Tabular Summary
You can export the Bar chart, Line chart, and Pie chart in the following formats:
Xlsx with Steps, Xlsx without Steps, Chart in PNG, Chart in JPEG, Chart in PDF, Chart in SVG
Limitation
The “Export to Word and PDF” Confluence feature is not supported for the QMetry Charts macro.